The trace recorder is responsible for collecting trace data and runs on the target hardware as part of your RTOS application. It is provided as C source code in the main FreeRTOS .zip file download.
Trace recordings are viewed in the FreeRTOS+Trace PC application.
This page provides quick start instructions only. Refer to the help menu in the FreeRTOS+Trace application for more detailed information.
Steps to trace enable your RTOS application:
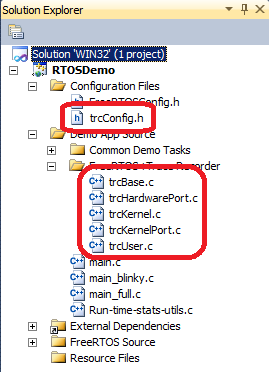
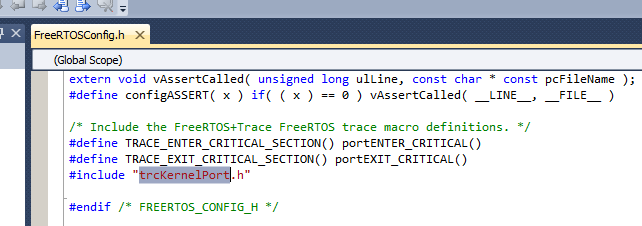
Inclusion of trcKernelPort.h in the same project.
Click to enlarge.
The trace recorder requires a configuration header file called trcConfig.h. A template trcConfig.h file is located in the ConfigurationTemplate sub-directory.
Also depending on the port and development environment it may be necessary to use the pre-processor to prevent the configuration file from being included from assembly files. For example, in IAR this can be done as follows...
/* The IAR C compiler automatically defines __ICCARM__. */
#ifdef __ICCARM__
#include "trcKernelPortFreeRTOS.h"
#endif
Preventing the RTOS trace header file from being included from assembly files when using the IAR compiler
...and in MPLAB it can be achieved as follows:
/* The MPLAB assembler automatically defines __LANGUAGE_ASSEMBLY. */
#ifndef __LANGUAGE_ASSEMBLY
#include "trcKernelPortFreeRTOS.h"
#endif
Preventing the RTOS trace header file from being included from assembly files when using the MPLAB compiler
To start a recording call uiTraceStart(). To stop a recording call vTraceStop(). It is not necessary to stop a recording before extracting the recorded data.
Most debuggers are able to save RAM contents to a file, and the FreeRTOS+Trace help file provides instructions on using the IAR, ST-Link, Rowley CrossStudio, Keil uVision, and Renesas HEW tools. There are a few other environments that have direct built-in or plug-in FreeRTOS+Trace support. These are listed below.
If you are using a J-Link debug interface then the recorded data can be retrieved directly from within FreeRTOS+Trace using the J-Link menu.

If you are using Atmel Studio 6 then Atmel's MemoryLogger extension, available from the Atmel Gallery, automatically detects the path to FreeRTOS+Trace, if installed, and gives you a single-click upload and refresh. You can use the extension while debugging, and optionally get an automatic refresh of the trace data each time the MCU is halted.
If you are using MPLAB X then an MPLAB plug-in allows you to save the recorded data to disk so it can be opened from within FreeRTOS+Trace.
To install the plug-in into MPLAB X:
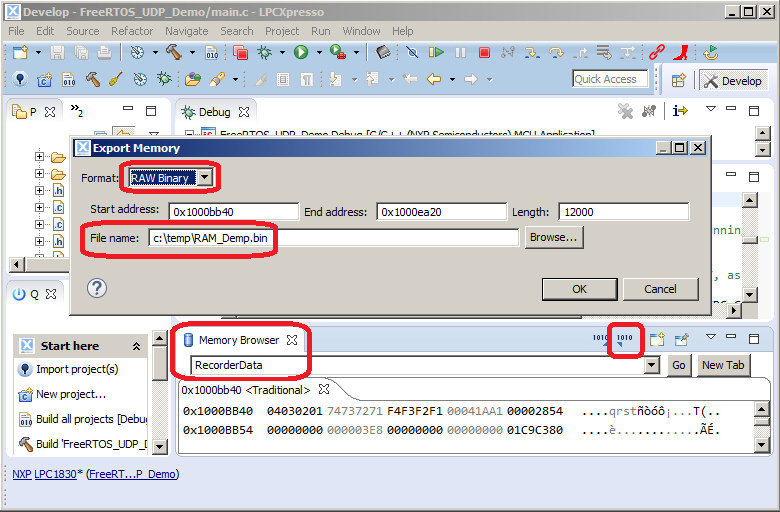
Finally, although Eclispe does not (yet) have built in support, as there are so many Eclipse users it is worth highlighting how to dump RAM to a disk in that environment. This is demonstrated in the image below (LPCXpresso shown in the image).