FreeRTOS+TraceTM
Unprecedented visibility into the run time
behaviour of FreeRTOS applications
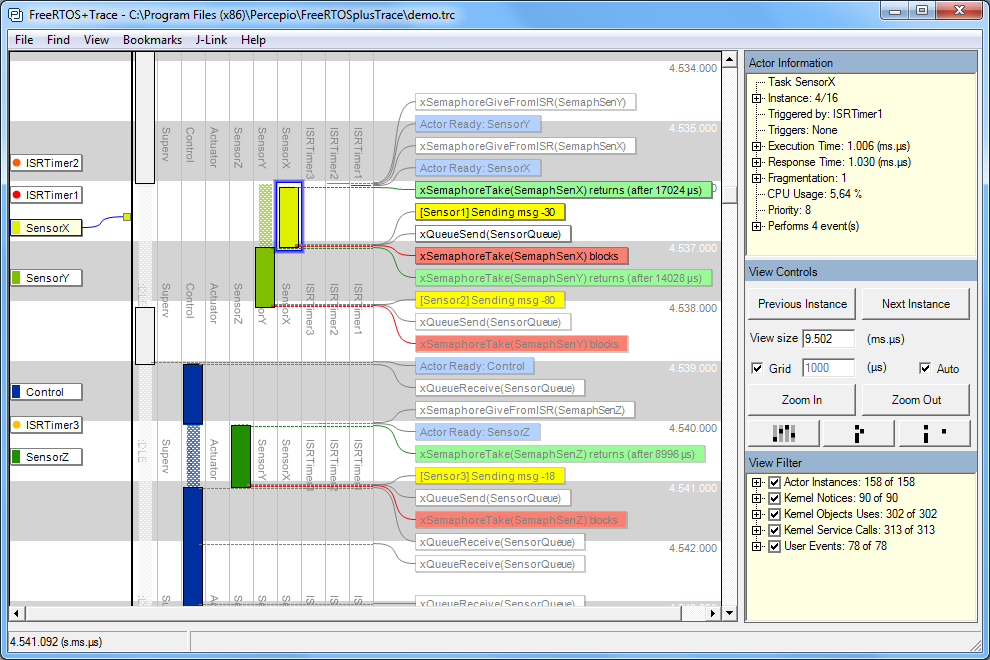
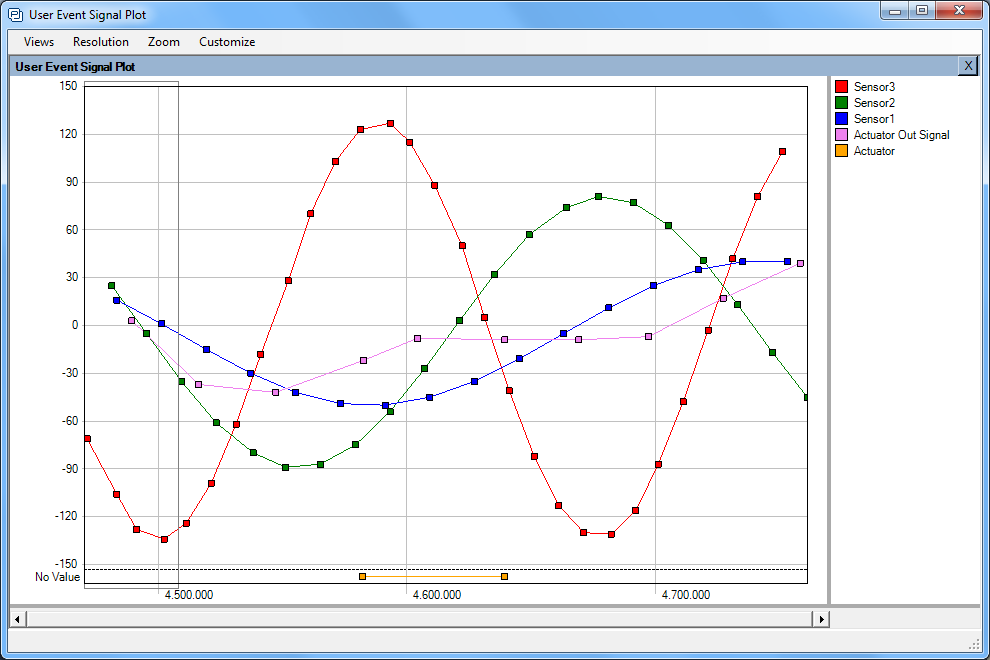
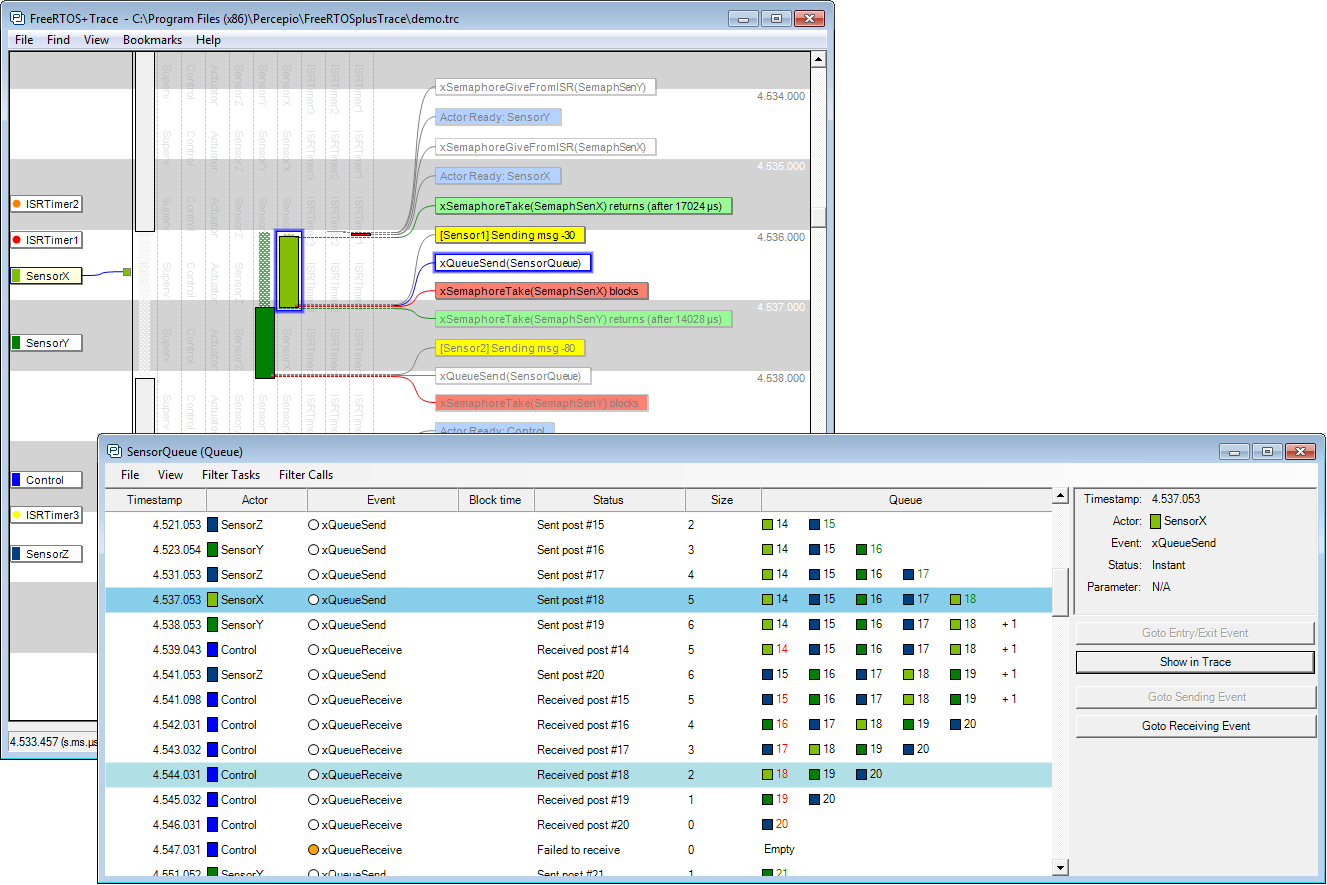
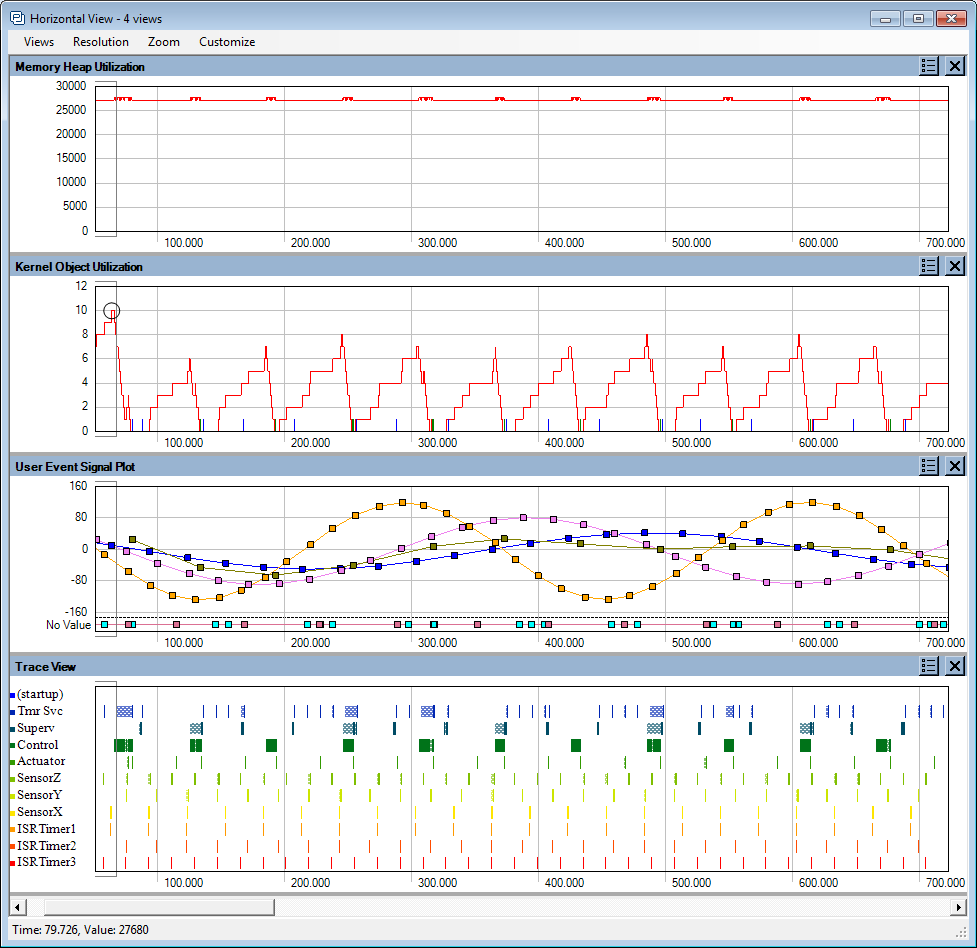
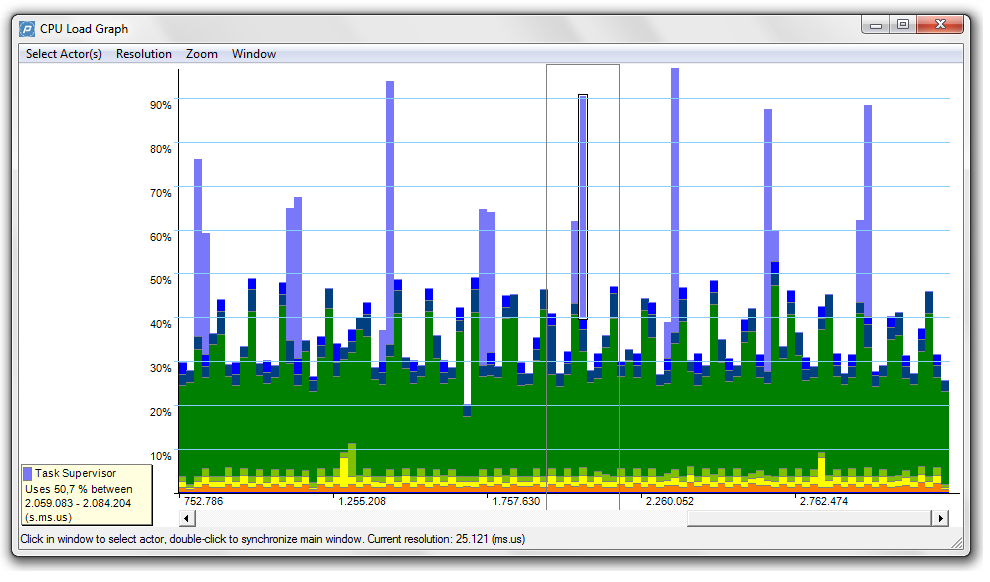
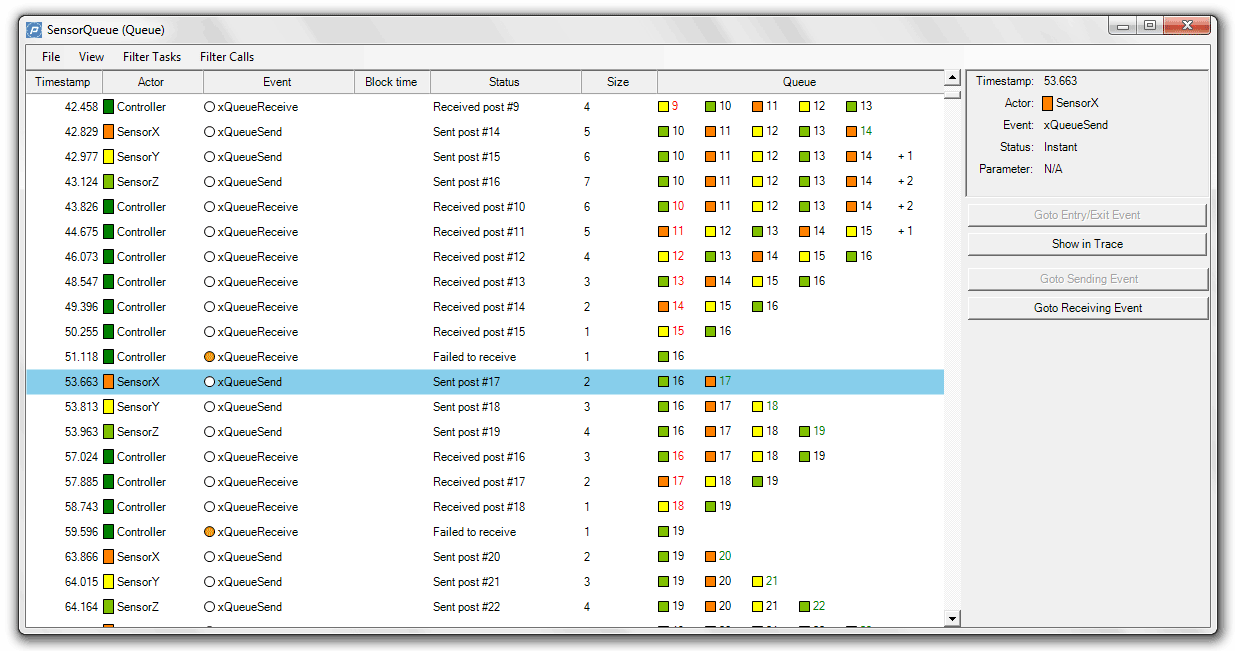
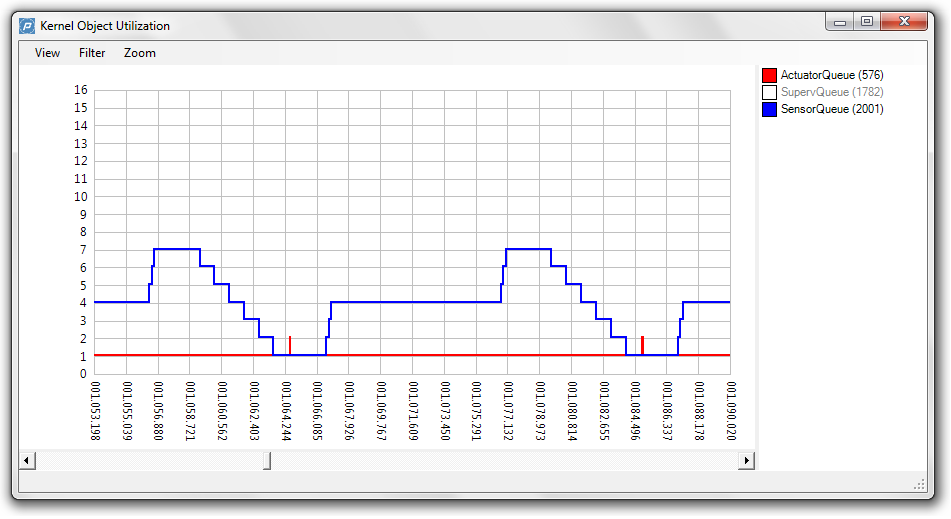
A Selection of the 25+ Graphically Interconnected Views
Click an image to enlarge
FreeRTOS+Trace introduction video
Introduction
FreeRTOS+Trace from Percepio is a powerful runtime analysis tool for FreeRTOS applications.
It captures valuable dynamic behaviour information for offline display
in more than 25 graphically interconnected views. The captured
information is invaluable when you want to troubleshoot, optimise, or simply
analyse the performance of your FreeRTOS based product.
FreeRTOS+Trace can be used side-by-side with a traditional debugger, and
complements your debugger by visualizing the real-time execution of tasks and ISRs, including FreeRTOS calls and your own "User Events".
Integration
FreeRTOS+Trace has two components - a PC application and a trace recording library.
The trace recording library is provided as C source code for easy
inclusion in your FreeRTOS project build. The library itself uses the standard
FreeRTOS trace macros.
FreeRTOS+Trace can obtains traces through your existing debugger interface or any other communication interfaces you might have available, such as TCP/IP or USB, so does not depend
on additional hardware. FreeRTOS+Trace supports continouos streaming and also in-memory "snapshot trace" that allows for capturing rare errors
in deployed hardware that are not easily reproducible in a bench test.